On-Site Polls: Sample Sizes That Matter
On-site polls are one of the fastest ways to learn what visitors want while they are in the middle of deciding, comparing, or struggling. The catch is that a po

On-site polls are one of the fastest ways to learn what visitors want while they are in the middle of deciding, comparing, or struggling. The catch is that a poll with 23 responses feels informative but is often too noisy to drive a real decision.
This guide is about sample sizes that actually matter for on-site polls, written for SaaS teams who need to ship decisions (not write a stats thesis). You will leave with practical response targets, simple margin-of-error math, and a way to estimate how much traffic you need to hit your numbers.
What “enough responses” means for an on-site poll
Before you calculate anything, be clear on what you are trying to do. On-site polls usually fall into three buckets, and each one needs a different level of certainty:
1) Directional insight (explore)
You want to learn what topics, objections, or use cases exist. You are not committing roadmap or pricing changes yet.
- Example: “What stopped you from starting a trial today?”
- Output: a ranked list of themes to investigate
2) Prioritization (choose)
You want to pick between a few options, or decide what to fix first.
- Example: “Which one would make you more likely to upgrade?”
- Output: a confident top choice (or confirmation that it is too close)
3) Measurement (track)
You want a baseline metric and to watch it move over time.
- Example: “How easy was it to set up your first integration?”
- Output: trend reliability (week over week, release over release)
The more irreversible (and expensive) the decision, the more sample size matters.
The quick math: margin of error for poll results
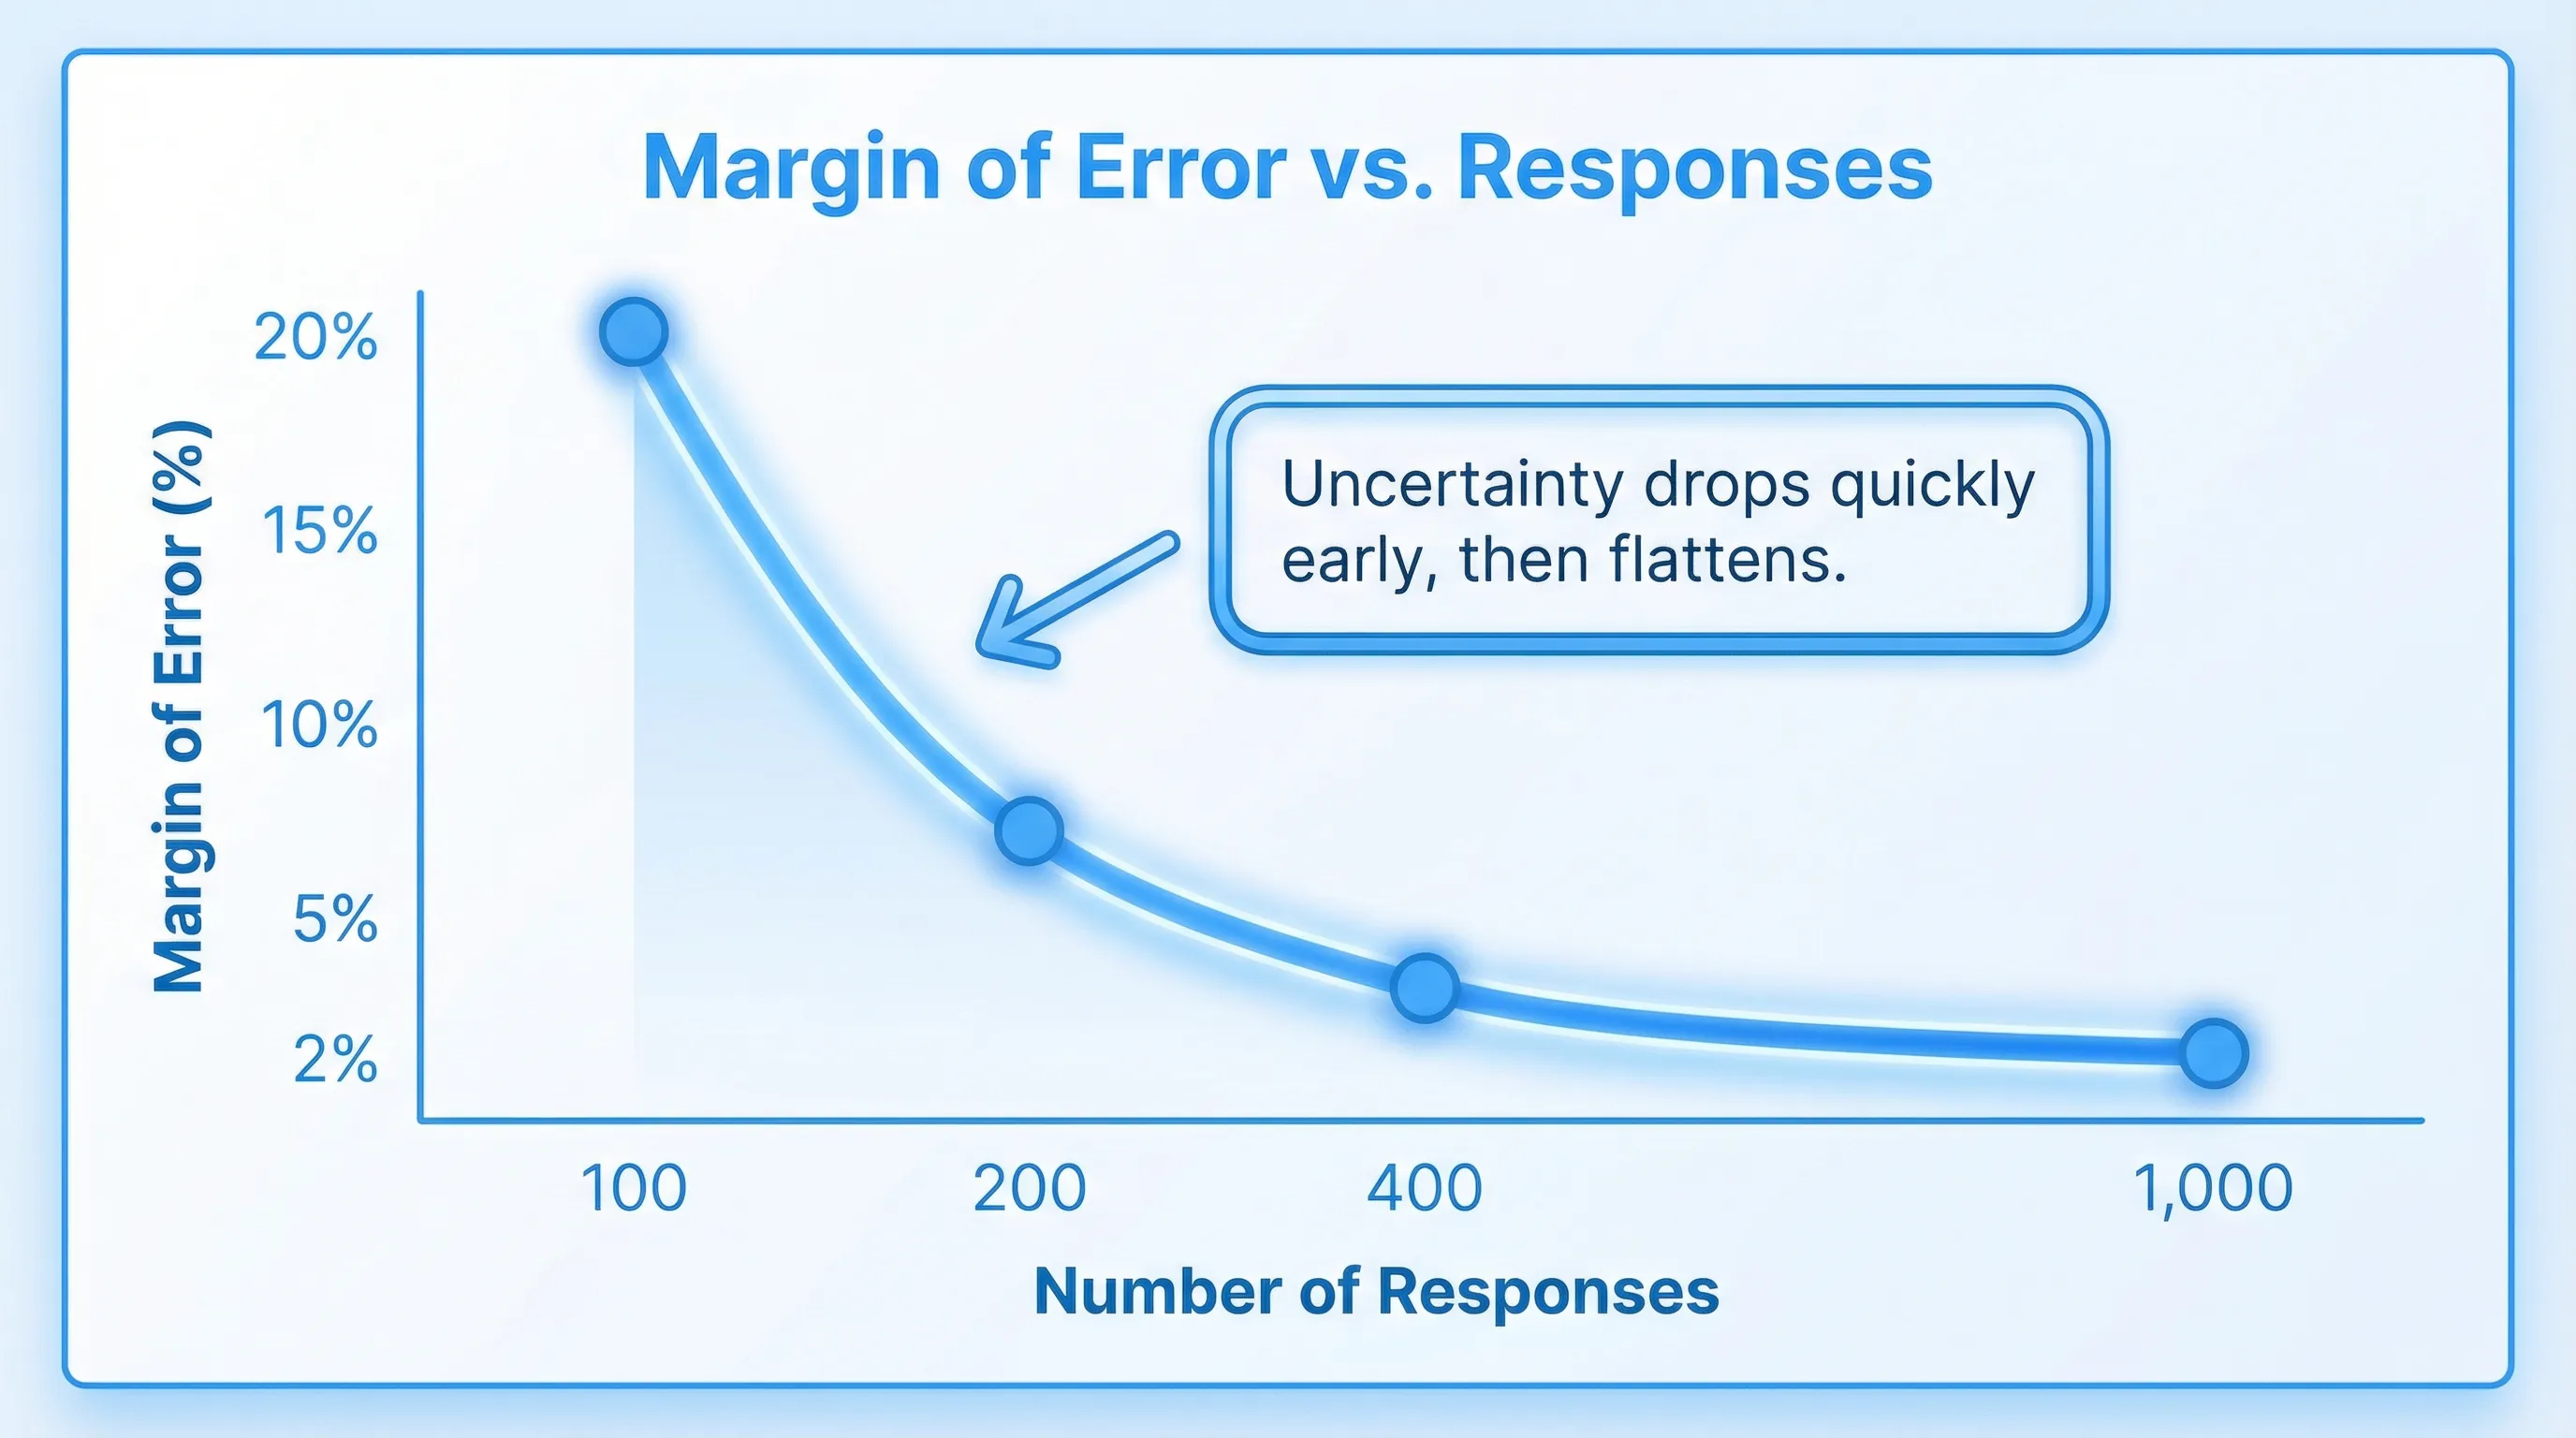
Most on-site polls are multiple choice questions where you look at the share of responses for each option (a proportion). The core idea is margin of error (MOE): how much your observed percentage might differ from the “true” percentage if you could ask everyone.
A common approximation for a proportion is:
- MOE ≈ z × √(p(1 − p) / n)
Where:
- n = number of responses
- p = observed proportion (worst-case variability happens around p = 0.5)
- z = z-score for your confidence level (about 1.96 for 95% confidence)
If you assume worst case (p = 0.5), you can estimate a safe response target:
- n ≈ (z² × 0.25) / MOE²
This is the same logic used by many common sample size explanations and calculators (for example, SurveyMonkey’s margin of error overview and Qualtrics’ sample size guidance).
Response targets for common margins of error (95% confidence)
| Desired margin of error (approx.) | Responses needed (n) | How it feels in practice |
|---|---|---|
| ±10% | ~96 | Directional, good for early reads |
| ±7% | ~196 | Solid for prioritization when options are not close |
| ±5% | ~385 | Strong for decisions that affect pricing, packaging, onboarding |
| ±3% | ~1,067 | Measurement-grade, useful for baselines and trend tracking |
Two practical notes:
- If your poll result is not near 50/50 (for example, an option has 10%), the actual MOE for that option is smaller than worst-case.
- If you only get 80 responses but one option is at 70%, you can still make a reasonable call. The risk is highest when results are close.
A decision rule you can actually use: “Is the lead bigger than the noise?”
SaaS teams often do not need “statistical significance” language, they need a stopping rule.
Use this simple check for a two-front-runner poll:
- Estimate your MOE (use the table above).
- Compare the top option vs the runner-up.
- If the gap is comfortably larger than the MOE, treat it as a decision.
Example:
- 200 responses (about ±7% worst-case MOE)
- Option A: 41%
- Option B: 36%
That 5-point lead is smaller than the worst-case noise. You can report it as “slightly ahead” but not as a firm winner. If A were 48% and B were 33%, the 15-point gap is large enough to act.
Practical sample-size targets by common SaaS use cases
If you do not want to think in MOE, use response targets by intent.
| Poll use case | Typical question | Recommended responses | Why |
|---|---|---|---|
| Pricing page objection scan | “What is missing to make this a yes?” | 50 to 150 | Finds themes fast, you will follow up qualitatively |
| Feature prioritization (top 1 of 4) | “Which should we build next?” | 150 to 300 | Enough to avoid chasing noise when top options are close |
| Onboarding friction | “What blocked your setup today?” | 100 to 250 | Usually you want a clear #1 friction point |
| Upgrade intent | “What would make you upgrade?” | 200 to 400 | Monetization decisions deserve tighter error bars |
| Post-resolution CSAT pulse | “Did we solve your issue?” | 200 to 1,000+ (ongoing) | Better as a tracked metric, not a one-off |
These are not magic numbers. They are “ship it” thresholds that balance speed with reliability for most mid-traffic SaaS businesses.
Sample size is not traffic, plan for response rate
On-site polls do not get 100% response rates. You should translate response targets into the number of times the poll needs to be shown.
Impressions needed is roughly:
- Impressions ≈ Responses / Response rate
Response rates vary a lot based on intent, timing, and friction. A low-friction, one-click poll triggered after a meaningful action can outperform a generic homepage poll by multiples.
What traffic you need (quick planning table)
| Response target | If response rate is 1% | 3% | 5% | 10% |
|---|---|---|---|---|
| 100 responses | 10,000 views | 3,334 | 2,000 | 1,000 |
| 200 responses | 20,000 views | 6,667 | 4,000 | 2,000 |
| 400 responses | 40,000 views | 13,334 | 8,000 | 4,000 |
If your site does not have the traffic for a high-confidence poll, you still have options:
- Narrow the poll to higher-intent pages (pricing, trial start, checkout, docs error states).
- Reduce friction (one click, optional comment).
- Run the poll longer.
- Treat it as directional and combine it with follow-ups.
Segmentation multiplies required sample size
A common mistake is to run a poll, get 300 responses, then slice by plan tier, device, or channel and try to make decisions inside each segment.
If you need reliable reads per segment, you need sample size per segment, not overall.
Example:
- Goal: ~200 responses to prioritize onboarding fixes
- You want to compare Free vs Pro vs Business
You may need roughly:
- 200 responses per tier (600 total)
If one segment is small (say Business is 10% of traffic), you will either:
- Run the poll longer
- Target that segment specifically (for example, only show to logged-in Business accounts)
- Accept larger uncertainty for that segment
When small samples are still useful (and how to use them safely)
You do not need 385 responses for every poll. Small samples can be excellent when you treat them correctly.
Use small-n polls to discover language, not percentages
With 30 to 80 responses, you can often extract:
- New objection categories you did not anticipate
- The exact words people use (great for landing page copy)
- The moments when confusion spikes (a specific step, screen, or plan)
The trick is to avoid over-interpreting the rank order when options are close.
Use the “rule of three” for rare events
If you are trying to learn whether a serious issue is happening (and you observe zero occurrences), a useful heuristic is the “rule of three”: with n observations and zero events, the upper 95% bound is about 3/n (commonly cited in statistics references, for example the Wikipedia summary)).
- If 0 out of 100 respondents report “security concerns,” it does not mean it is impossible.
- It suggests it is likely below about 3% among similar visitors.
This is helpful for sanity-checking “nobody cares about X” conclusions.
Bigger sample sizes cannot fix biased polls
Teams often try to solve a poll problem by “getting more responses.” If the poll is biased, more responses just makes you more confidently wrong.
Here are the highest-impact bias sources for on-site polls:
Timing bias (asking the wrong moment)
If you ask a pricing question before someone has seen value, you are measuring first impressions, not buying intent.
Placement bias (sampling the wrong population)
A poll on the homepage samples “curious visitors.” A poll on the upgrade screen samples “activated users feeling friction.” Those are different realities.
Friction bias (only the most motivated respond)
Long forms, mandatory fields, or intrusive popups skew toward people with strong emotions.
Leading options and missing options
If you include “Too expensive” but not “Not sure what I get,” you are nudging outcomes.
If you want decisions you can defend, spend as much time on who sees the poll as on how many respond.
A simple workflow for on-site polls that produce decisions
Define the decision and the threshold
Write the decision in a sentence:
- “If the top objection is clearly pricing-related, we will test a pricing page rewrite and add a calculator block.”
Then set a threshold:
- “We will act if the leading option is ahead by at least ~8 points at 200 responses.”
This prevents “interpretation drift” after the data comes in.
Choose a sample-size target that matches the risk
- For copy tweaks and exploratory work, aim for ~100 responses.
- For roadmap prioritization or funnel changes, aim for ~200 to 400.
- For metrics you track over time, aim for higher ongoing volume.
Target high-intent moments to raise signal per response
If you only show a poll when the visitor has context, you need fewer responses to learn something useful.
Common high-signal triggers for SaaS:
- After viewing pricing for 20 to 40 seconds
- After clicking “Start trial” but before completing signup
- After an error or failed integration attempt
- After using a core feature for the first time
(If you want deeper guidance on safe placement patterns, this pairs well with Modalcast’s guide on website feedback widget placement.)
Keep it one click, then optional comment
A strong pattern is:
- Poll: one click (multiple choice)
- Follow-up: optional free-text (“Anything else?”)
This preserves response rate while still giving you qualitative context.
Report results with uncertainty, not fake precision
Instead of “42.3% chose option A,” report:
- “Option A leads by ~10 points at 250 responses, likely a real lead.”
- “Top two options are within the noise at 150 responses, we are collecting 100 more.”
Stakeholders trust you more when you acknowledge the limits.
Running polls in ModalCast without over-surveying
If your goal is to reach a meaningful sample size without hurting UX, the best lever is targeting and restraint.
With a lightweight widget approach (like ModalCast), teams typically focus on:
- Page and trigger targeting so the poll appears when the visitor has enough context to answer
- Low-friction formats (polls and microsurveys) to protect response rate
- Frequency capping so the same visitor is not repeatedly interrupted
- Analytics review to watch response rate and completion rate as you iterate
Two practical ways to hit sample targets faster:
- Run a short poll on a single high-intent page (for example, the pricing page), rather than site-wide.
- Rotate questions. Keep one poll live until it hits its target, then swap it out.
Related reading if you are building a feedback program:
The takeaway: pick a number that matches the decision
On-site polls are most valuable when you treat them like decision tools:
- If you need a directional read, 50 to 150 responses can be enough.
- If you need to choose between close options, plan for 150 to 400.
- If you need measurement-grade tracking, you may need 1,000+ over time.
Then design the poll so the right people see it at the right time, because relevance beats raw volume.
If you want to run targeted, low-friction polls with a single on-site widget, you can start with a small pilot in ModalCast and aim for your first 100 high-signal responses before you expand.
