Engagement Metrics That Predict Retention in 2025
If you want reliable retention in 2025, focus your energy where it compounds. The strongest predictor of whether a user stays is not a slogan or a discount, it is the set of early engagement behaviors that get them to value quickly and keep them coming back on their natural cadence.

If you want reliable retention in 2025, focus your energy where it compounds. The strongest predictor of whether a user stays is not a slogan or a discount, it is the set of early engagement behaviors that get them to value quickly and keep them coming back on their natural cadence. Privacy shifts and the slow death of third‑party cookies mean first‑party product signals are now your best predictors. This guide breaks down which engagement metrics matter, how to instrument them, and the practical plays to move them.
What makes a metric predictive, not just descriptive
Before chasing dashboards, pressure test each metric against five criteria:
- Proximity to value, the behavior should sit close to the moment the user achieves the outcome they signed up for.
- Time bounded, measured in a clear window like first session, first 24 hours, first 7 days.
- Repeatable, users can and should repeat it without gaming the system.
- Segmentation sensitive, it should vary across cohorts, plans, roles or acquisition channels.
- Actionable, the team can run interventions that plausibly move it.
Frameworks like the North Star approach focus teams on value creation activities rather than vanity counts. If you need a refresher, see Amplitude’s explanation of the North Star Metric. Benchmarks can help with relative context, though your product’s natural cadence is more important than generic targets. Mixpanel’s public benchmarking is a useful sanity check across categories.
The engagement metrics most likely to predict retention in 2025
Here is a compact overview. We will dive into how to operationalize several of these right after the table.
| Metric | Definition | Why it predicts retention | How to collect quickly |
|---|---|---|---|
| Activation rate within a TTFV window | Percent of new users who complete your activation sequence within the target time to first value | Proves the product delivered value early, reducing early churn risk | Instrument activation events and a timestamp, analyze first 24 hours or first 7 days |
| Time to first value (TTFV) | Minutes or hours from signup to first meaningful outcome | Lower TTFV strongly correlates with ongoing usage | Track signup timestamp and first value event timestamp |
| Setup or integration completion | Data source connected, import finished, or key integration live | Integrations create switching costs and unlock repeat usage | Log a completed_setup event with metadata about integrations |
| Core action frequency in week 1 | Number of times a user performs the primary action in the first 7 days | Frequency establishes habit and validates fit | Count core_action events per user over 7 days |
| Stickiness ratio | DAU over WAU or WAU over MAU depending on cadence | Captures habit formation relative to the expected usage rhythm | Maintain DAU, WAU, MAU and compute ratios |
| Feature breadth by day 14 | Count of distinct core features used by day 14 | Broader use suggests deeper embed and higher switching cost | Track feature_used with feature_id, count uniques |
| Collaboration density | Invites sent, active teammates, or shared artifacts per account | Team adoption is a strong moat in B2B SaaS | Log invite_sent and collaborator_active per account |
| Content or data created | Projects, dashboards, docs, or SKUs created early | Creation anchors future return visits to manage or consume that asset | Track created_object events with object_type |
| In‑product CSAT on key flows | One question satisfaction after the user completes a critical task | Early satisfaction flags friction that leads to churn | Trigger a short survey after the task, store rating and verbatim |
| Update discovery to adoption | Users who saw a relevant update and used the new feature within 14 days | Shows your ability to drive adoption and expand value surface | Track update_viewed and subsequent feature_used with feature_id |
A note on customer experience research, the link between experience quality and loyalty is well documented. Harvard Business Review quantified this for consumer services in The Value of Customer Experience, Quantified, where better experience correlated with higher future spend and likelihood to remain a customer. You can read their analysis here, HBR article.
Deep dive on the highest leverage predictors
1) Activation rate within a defined TTFV window
Define the sequence of events that proves a user experienced value. For an email marketing tool this could be import contacts, send campaign, receive at least 1 open. For a dashboard product it might be connect data, create dashboard, view dashboard with populated charts. Measure the percent of new users who complete this within your target window.
How to move it:
- Shorten steps, remove optional setup from the first session.
- Offer a guided path based on intent. A one question prompt like What are you trying to do today is enough to route users.
- Show a contextual nudge when a user stalls for 30 seconds on a blank state.
With Modalcast, you can deliver the intent prompt as an instant microsurvey, and follow with a targeted message that deep links to the next step. See our guide on how to set up microsurveys for a quick implementation approach.
2) Time to first value
TTFV is the raw clock from signup to the first moment the user gets a result. It is often the most sensitive metric for early churn. You can improve TTFV without writing new features by changing defaults, preloading sample data, or offering a template that matches the user’s job to be done.
Practical measure, track two timestamps, signup_at and first_value_at, then trend the distribution by acquisition channel and plan.
3) Setup or integration completion
For most B2B products, value often begins at the first data connection. If the integration fails or takes days, retention suffers. Treat setup completion as a first class product goal.
Practical plays:
- Show a tight checklist of 2 to 3 must do items only.
- Trigger a help message if a user abandons the setup screen more than once.
- Use a real time poll to ask what is blocking progress, then address the top two issues.
You can collect this qualitative blocker data with a quick in‑app form using Modalcast and route common issues to updated help content. Our post on maximizing feedback collection covers timing and question design that avoids survey fatigue.
4) Core action frequency in week 1
Frequency is a habit signal. The exact number that predicts retention is product specific. The right method is to segment week 1 users by how many times they completed the core action and compare their month 2 retention. The elbow in that curve is your target threshold.
How to move it:
- Celebrate the first completion and suggest the next best action while motivation is high.
- Offer a lightweight shortcut to repeat the action, like duplicating the last configuration.
- Send a timely reminder inside the app the next time they log in, not just over email.
5) Feature breadth by day 14
Users who engage with multiple core features usually stick because they extract more value. Track the count of distinct core features used in the first two weeks. Validate that breadth predicts retention in your cohorts before optimizing for it.
How to move it:
- Highlight a complementary feature only after the first value is achieved.
- Use a small in‑product announcement when a user qualifies for a related capability.
You can ship concise product updates through a Modalcast message and then measure adoption uplift. Our overview on boosting user engagement includes practical announcement patterns that do not interrupt flow.
6) In‑product CSAT on key flows
A one question satisfaction pulse right after a critical task picks up friction you will miss in aggregate metrics. Correlate low CSAT with drop off and drive fixes based on the verbatim reasons.
How to implement:
- Trigger a two point or five point rating after a core task is completed, not before.
- Add a single open text why question only if the user selects a low rating.
- Route patterns to the owning team weekly.
Our guide on CSAT surveys walks through wording, sampling, and analysis to get signal without noise.
Find your product’s retention predictors in 5 steps
The following workflow is fast enough for a 2 to 4 week sprint and robust enough to inform quarterly goals.
Map value and define events
Document your primary job to be done and the aha moment users should reach. Translate that into 5 to 10 concrete events with consistent names and properties. Keep a clear schema so teams do not create duplicates over time. Amplitude’s taxonomy and North Star resources are useful references, see the North Star Metric overview mentioned earlier.
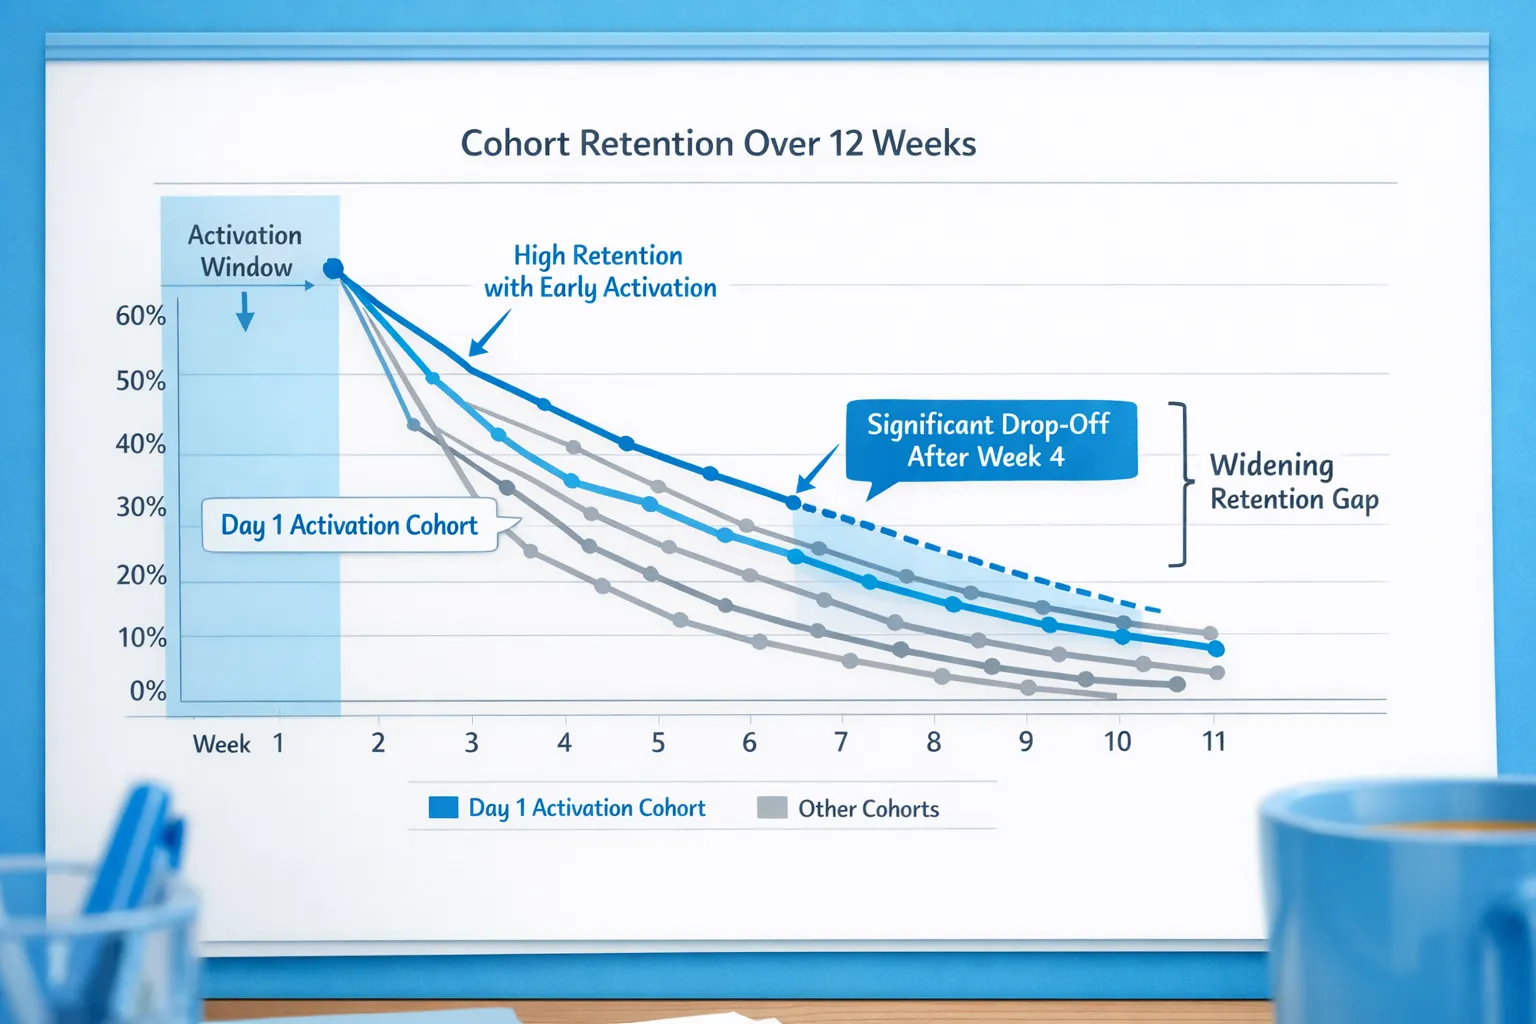
Baseline cohorts by acquisition month
Build retention curves by signup month and calculate month over month retention at 4, 8, and 12 weeks. This gives you a simple truth set before layering predictors.
Slice cohorts by early behaviors
For each candidate metric, create bands, for example TTFV under 1 hour, 1 to 24 hours, over 24 hours. Compare downstream retention, expansion, and support burden across bands. This highlights the thresholds that matter.
Validate with simple models if you have volume
If your data size allows, run a logistic regression with retained at 60 days as the dependent variable and candidate metrics as features. You are seeking directional signals and interaction terms, not a perfect score.
Codify targets and owners
Convert the strongest predictors into a team goal. Example, increase activation within 24 hours from 38 percent to 50 percent, owned by product onboarding, with marketing and success support. Put the metric on a shared dashboard and review weekly.
Real world patterns by product type
- Collaboration or documentation tools, creation of a first artifact and inviting at least one collaborator in the first 3 days is a common divide between retained and churned accounts.
- Analytics and BI products, connecting a data source and viewing an auto refreshed dashboard weekly is a strong predictor. Users who only upload a CSV once often churn.
- Commerce enablement and plugins, the first live transaction or live data event is the threshold. Merchants who see value tied to revenue keep coming back.
- Education and course platforms, completing lesson one and returning for a second session within 3 days is more predictive than long session one times.
Treat these as starting hypotheses and validate against your own cohorts.
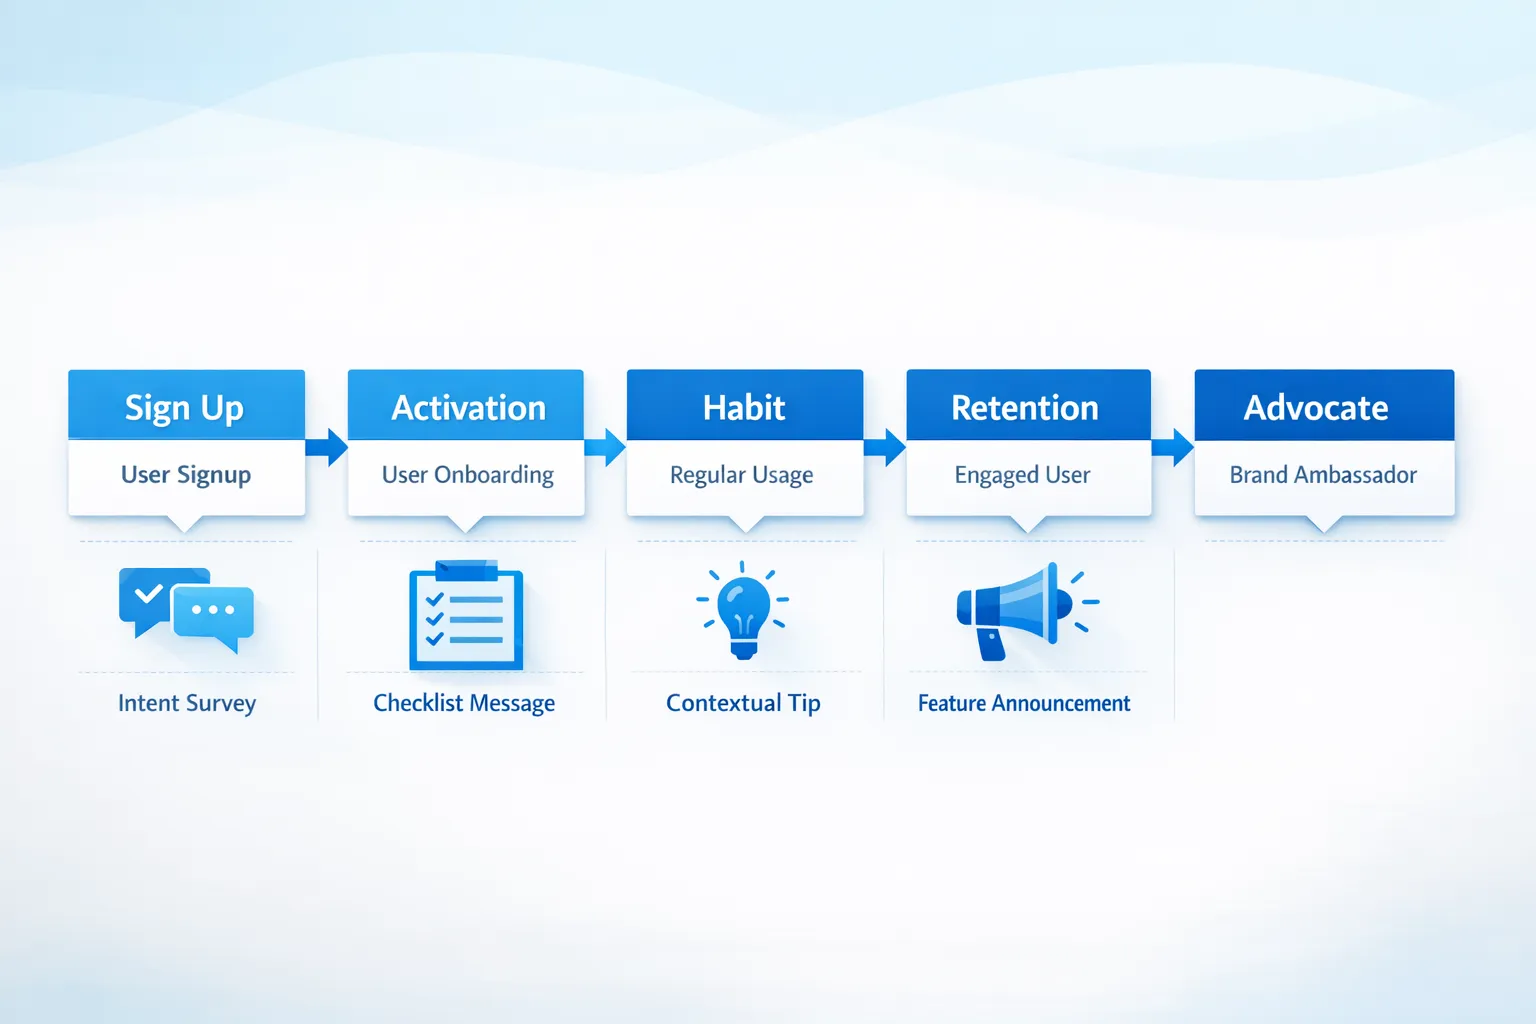
Turning insights into action with on‑site messages and microsurveys
You do not need a complex growth stack to influence the predictors above. A small number of well timed, contextual interventions can be enough.
- Intent routing right after signup, ask What are you here to do today and route to the right template or checklist. Deliver this in a Modalcast microsurvey, then follow with a targeted message.
- Stall recovery during setup, if a user returns to the setup page twice without finishing, display a short tip or offer a link to a concise help doc. Use Modalcast triggers tied to specific pages or elements.
- Celebrate the first core action, show a brief confirmation with a suggestion for the next best action. Tie it to a deep link rather than a generic tour.
- Pulse CSAT after a critical task, a two click rating with optional comment catches friction while it is fresh. Modalcast supports instant surveys and ratings inside the same widget feed as your messages.
- Drive feature breadth with update announcements, when a user qualifies for a related feature, show a small announcement and measure adoption. Avoid showing unrelated updates.
For implementation details on the widget itself, the quick start guide on setting up Modalcast can help you go live quickly.
A 30 day execution plan
Week 1, define and instrument
Agree on the activation definition, list the 5 to 10 events to capture, and implement tracking for signup, first value, core action, and setup complete. Add identifiers to link events to accounts and acquisition sources.
Week 2, baseline and segment
Generate first cuts of TTFV, activation within 24 hours, and week 1 core action frequency. Build simple retention curves by signup week, then slice by acquisition channel or plan.
Week 3, ship targeted interventions
Publish one intent survey at signup, one setup tip for stalled users, and one post task CSAT pulse. Keep messages brief and contextual.
Week 4, review and iterate
Compare cohorts that saw the interventions versus those that did not. If activation moved, expand the play. If not, revisit the activation definition or timing.
Common pitfalls to avoid
- Vanity metrics, pageviews and raw session counts rarely predict anything useful.
- Optimizing for clicks not outcomes, measure whether the user reached value, not whether they opened a tooltip.
- Over surveying, keep micro prompts short and purposeful to avoid fatigue.
- Ignoring cadence, a monthly tool will not look good on DAU. Use WAU or MAU where appropriate.
- Relying on averages, use distributions and cohort comparisons. Medians and percentiles are more informative for TTFV and frequency.
Bringing it together
Retention is the result of users finding value quickly and returning on their natural cadence. In 2025, your best predictors live inside the product, not in ad platforms. Start with activation and TTFV, validate a small set of behavioral predictors, and wire just a few contextual nudges and microsurveys to remove friction at critical moments.
If you want to test these ideas without building a new system, Modalcast makes it straightforward to ask a one question intent survey, show an onboarding tip, announce a feature, or collect quick CSAT in the same lightweight widget. You can start small, measure lift, and expand only what moves your predictors.
Additional reading to go deeper on measurement and prioritization:
- Amplitude’s North Star Metric
- Mixpanel’s benchmarks
- Harvard Business Review on customer experience value
